 After A 7x Five Year Run?")
- Some investors may be wondering if Broadcom’s share price still offers value after a large multi year run, or if most of the upside is already reflected in the stock.
- The shares closed at US$320.33, with a 3.7% decline over the last 7 days and a 7.9% decline over the last 30 days. Over the last 1 year the return sits at 45.3%, and the 5 year return is around 7x.
- Recent news coverage has focused on Broadcom’s role as a major semiconductor and infrastructure software player and how that position fits into long term technology spending themes. This context has shaped how investors think about the balance between future growth potential and changing risk perceptions, which in turn influences how the stock is priced today.
- Right now Broadcom has a valuation score of 1 out of 6. Next we will look at what different valuation methods indicate about that score, before finishing with a simpler way to judge whether the current price appears reasonable.
Broadcom scores just 1/6 on our valuation checks. See what other red flags we found in the full valuation breakdown.
Approach 1: Broadcom Discounted Cash Flow (DCF) Analysis
A Discounted Cash Flow, or DCF, model estimates what a business could be worth by projecting its future cash flows and then discounting those back to today using a required return. It is essentially asking what those future dollars are worth in today’s terms.
For Broadcom, the model uses a 2 Stage Free Cash Flow to Equity approach based on cash flow projections. The latest twelve month free cash flow sits at about US$26.9b. Analysts provide explicit free cash flow estimates out to 2029, and from 2030 onward Simply Wall St extrapolates further, with projected free cash flow of US$107.1b in 2030. All of these projected figures are then discounted back to today to arrive at an estimated intrinsic value per share of US$288.48.
Compared with the current share price of US$320.33, this DCF result implies the stock is about 11.0% overvalued on these assumptions, so the market price is ahead of this particular cash flow based estimate.
Result: OVERVALUED
Our Discounted Cash Flow (DCF) analysis suggests Broadcom may be overvalued by 11.0%. Discover 873 undervalued stocks or create your own screener to find better value opportunities.
Head to the Valuation section of our Company Report for more details on how we arrive at this Fair Value for Broadcom.
Approach 2: Broadcom Price vs Earnings
For profitable companies, the P/E ratio is a useful way to link what you pay for each share to the earnings that company is currently generating. It gives you a quick sense of how many years of current earnings the market is willing to pay for.
What counts as a “normal” P/E depends on what investors expect for future growth and how much risk they see in those earnings. Higher expected growth or lower perceived risk can support a higher P/E, while slower growth or higher risk usually calls for a lower one.
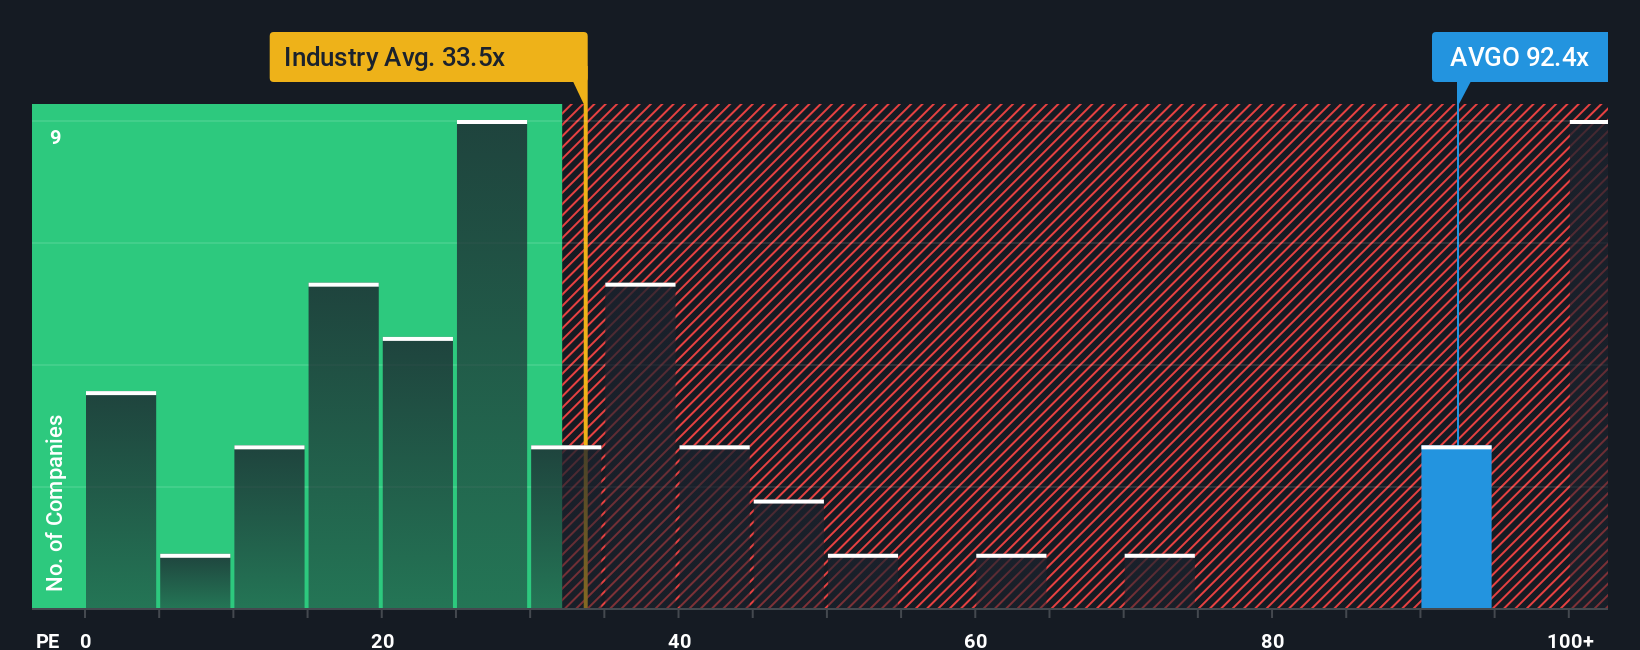
Broadcom currently trades on a P/E of 65.67x. That sits above the Semiconductor industry average of 42.19x and the peer group average of 59.52x. Simply Wall St’s Fair Ratio for Broadcom is 58.29x, which is their proprietary estimate of what a reasonable P/E could be given factors such as earnings growth, profit margins, industry, market cap and company specific risks.
This Fair Ratio is more tailored than a simple peer or industry comparison because it tries to adjust for Broadcom’s own characteristics rather than assuming all companies deserve similar multiples. With the actual P/E at 65.67x versus a Fair Ratio of 58.29x, the shares appear somewhat expensive on this measure.
Result: OVERVALUED
P/E ratios tell one story, but what if the real opportunity lies elsewhere? Discover 1426 companies where insiders are betting big on explosive growth.
Upgrade Your Decision Making: Choose your Broadcom Narrative
Earlier we mentioned that there is an even better way to understand valuation, so let us introduce you to Narratives, which let you attach a clear story about Broadcom to the numbers behind your own fair value, revenue, earnings and margin assumptions.
A Narrative is simply your view of how a company’s business might play out, translated into a forecast and then into a fair value, so your story, your numbers and your estimate of what the shares could be worth all line up.
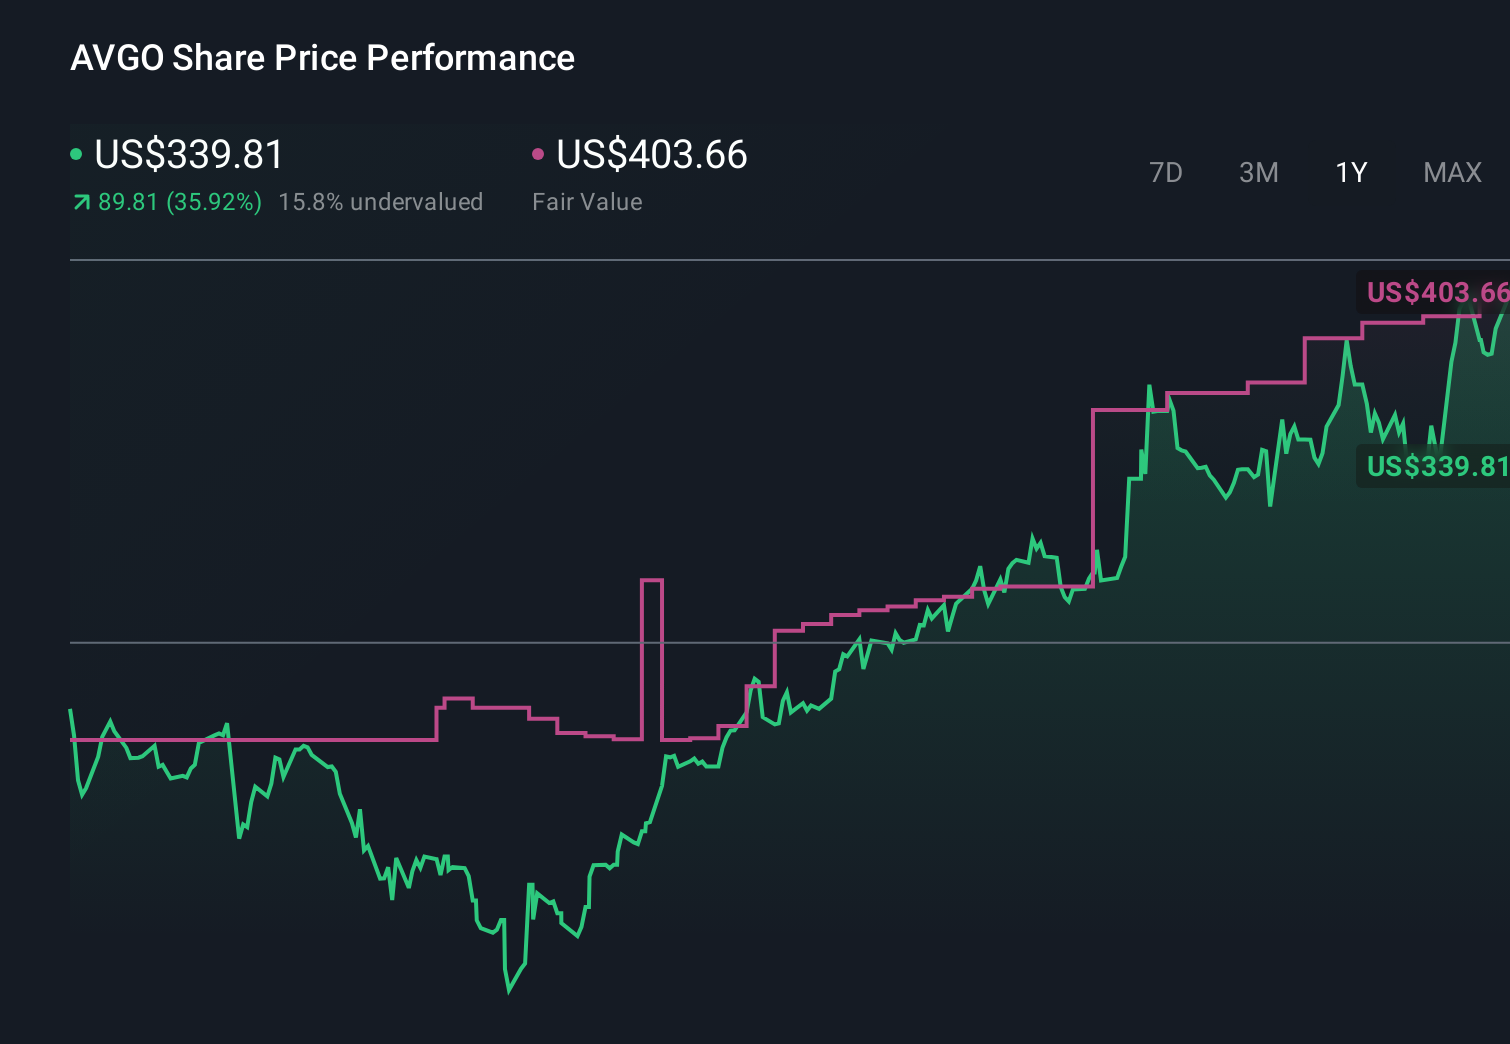
On Simply Wall St, within the Community page used by millions of investors, Narratives are an easy tool that help you compare your Fair Value to the latest share price, so you can decide whether the stock looks attractively or richly priced based on your own assumptions.
These Narratives are updated automatically when fresh information such as news or earnings is added, and you can see, for example, one Broadcom Narrative that assumes a higher fair value and another that assumes a lower fair value, reflecting how different investors can look at the same company and reach very different conclusions.
Do you think there’s more to the story for Broadcom? Head over to our Community to see what others are saying!
This article by Simply Wall St is general in nature. We provide commentary based on historical data
and analyst forecasts only using an unbiased methodology and our articles are not intended to be financial advice. It does not constitute a recommendation to buy or sell any stock, and does not take account of your objectives, or your
financial situation. We aim to bring you long-term focused analysis driven by fundamental data.
Note that our analysis may not factor in the latest price-sensitive company announcements or qualitative material.
Simply Wall St has no position in any stocks mentioned.
Valuation is complex, but we’re here to simplify it.
Discover if Broadcom might be undervalued or overvalued with our detailed analysis, featuring fair value estimates, potential risks, dividends, insider trades, and its financial condition.
Access Free Analysis
Have feedback on this article? Concerned about the content? Get in touch with us directly. Alternatively, email editorial-team@simplywallst.com